One of the best tools for visualizing and conceptualizing relationships between any topic is a mind map. We with a mind map when we started DataTools Pro in late 2023. The mind map is easy to conceptualize visually as we connect the dots between people, process, metrics, and data. This is something that all enterprises struggle with while transitioning from service and product based businesses to information based businesses. Businesses are not static, so managing complex relationships that change regularly requires building and understanding these relationships at the speed business happens!
As we started turning our mind map concept into reality, we knew relationships between metrics, topics, data and analytics assets like reports and understanding changes that occur is hard enough.
That is where data visualization delivers immense value to bring data to life. The same way data professionals understand “Entity Relationships”, business professionals should have “Metrics Relationships” to understand how business initiatives, operations, and strategy connect.
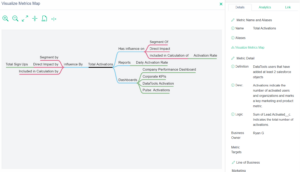
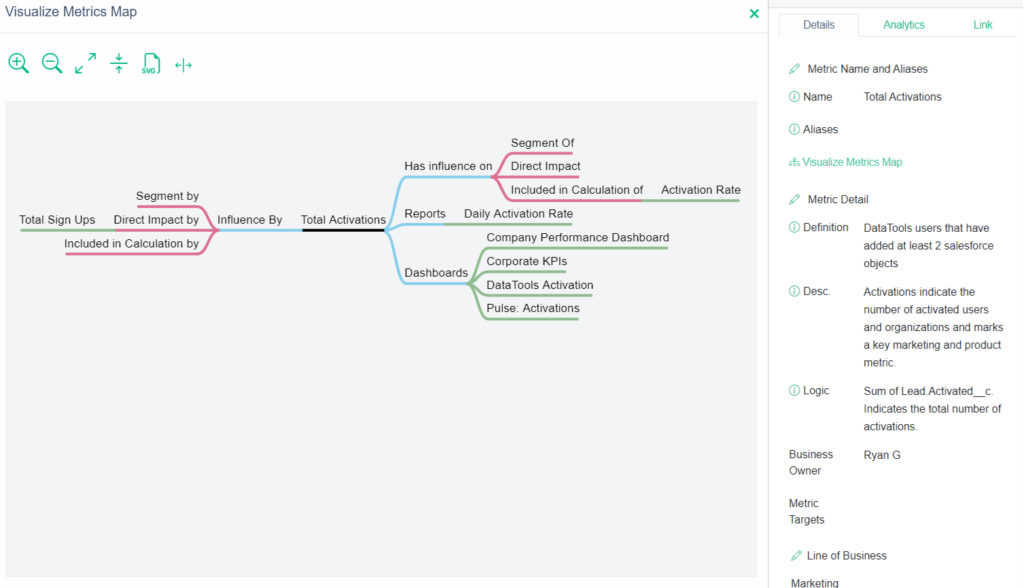
That is why we created our Metrics Map visualization, powered by DataTools Pro to systemize this process. The first iteration makes each metric the center of the universe (in our visualization visualization). From a single metric we want to know what influences a metric or KPI and what the metric has influence over. With this starting point to discover, understand and relate metrics, we can work backwards to data and forwards to outcomes!
Many analytics industry tech companies have focused on solving problems for accelerating data acquisition, transformation, and delivery. Generative AI, without contextual metrics glossaries jam packed with meta data will produce negligible results. It is the equivalent of hiring a data analyst and not explaining goals, metrics and analytics relates to the decisions out outcomes they influence.
We are excited to work with a number of like-minded partners in the realm of AI and data management to demonstrate profound improvements we are seeing when feeding our soon to be released metric maps API into generative AI analyst agents!
Create your first Metrics Mind Map from Salesforce and Tableau Pulse!
DataTools Pro is freely available for individuals and supports Salesforce and Tableau Pulse to build metrics glossaries and metrics maps.
Learn more about DataTools Pro