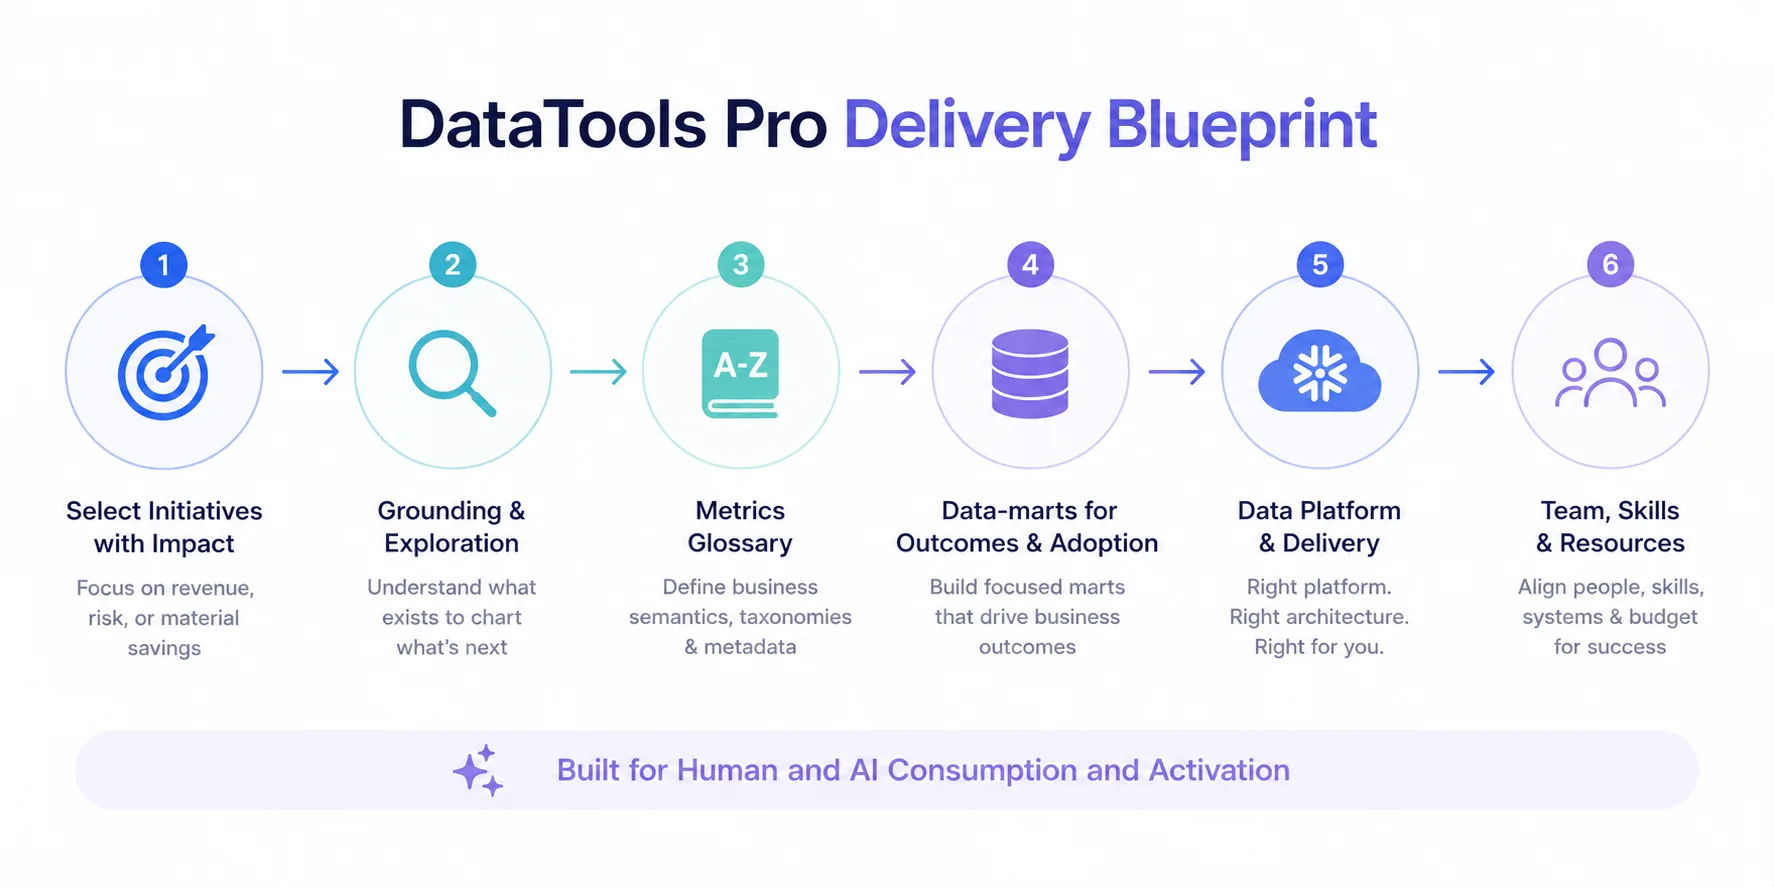
Continuous refinement, process hacking has led to our DataTools Pro AI BI Blueprint.
DataTools Blog: DataTools Pro
Testing Salesforce External Client App with our DataTools Portal
Posted on December 11, 2025 | BY Ryan Goodman
There have been so many changes to Salesforce connected apps in terms of integration and commercial requirements. Learn more

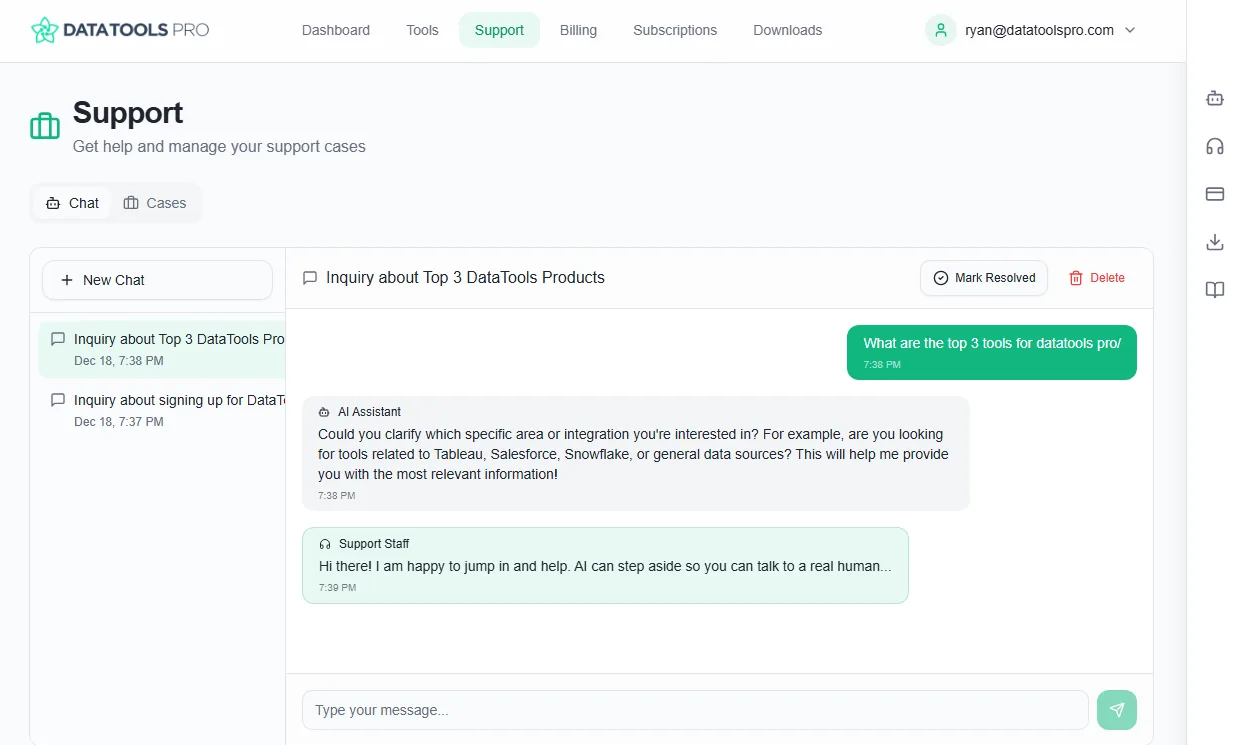
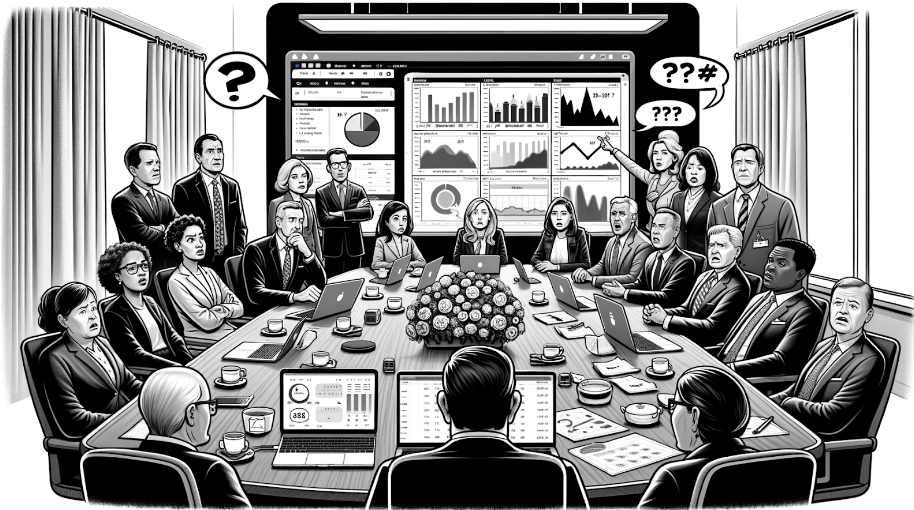
How DataTools Pro Resolves Cross-Department Communication Gaps
Posted on April 27, 2025 | BY Ryan Goodman
Communication across departments is like the oil in the machine that keeps a business running smoothly. When communication is clear ...

Collaborating Across Teams in Salesforce with DataTools Pro
Posted on February 03, 2025 | BY Ryan Goodman
Working together in a company can be challenging if teams don’t have effective ways to share information. In many businesses, ...

Streamline Team Collaboration in Salesforce with DataTools Pro
Posted on December 24, 2024 | BY Ryan Goodman
Collaboration is key when multiple teams work with complex business applications like Salesforce. Seamless teamwork across technical roles ensures that ...
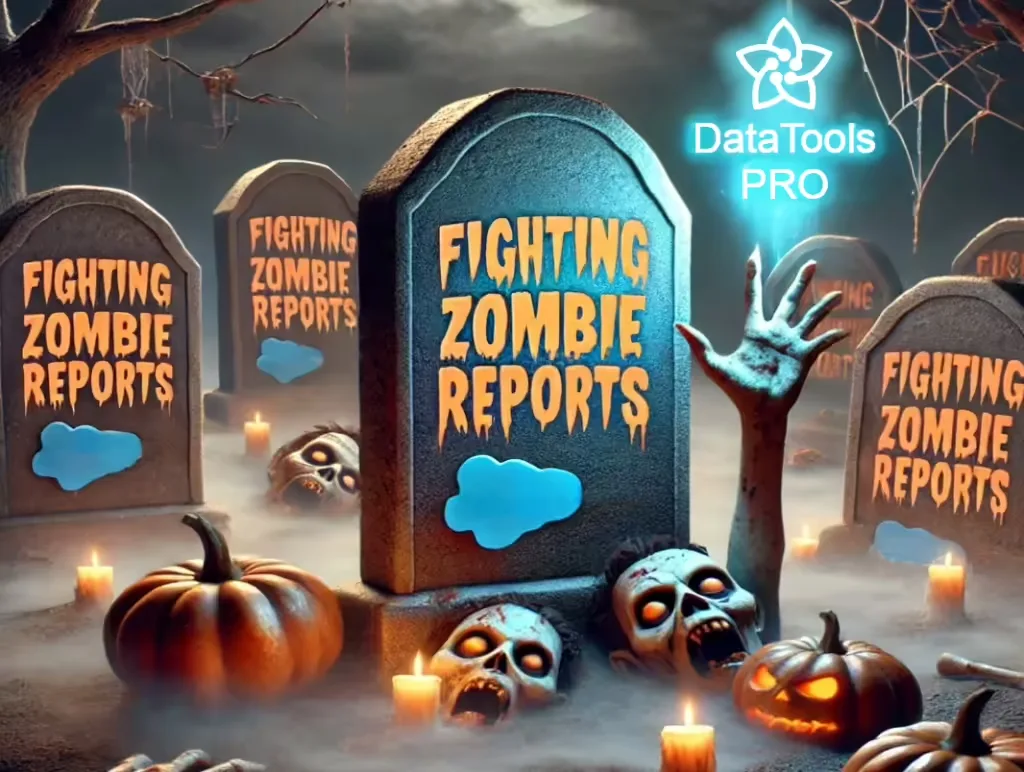
New DataTools Pro fights Salesforce zombie reports
Posted on October 25, 2024 | BY Ryan Goodman
Just in time for Halloween, we have new tricks and treats for DataTools Pro. Jam packed with integrations and a ...
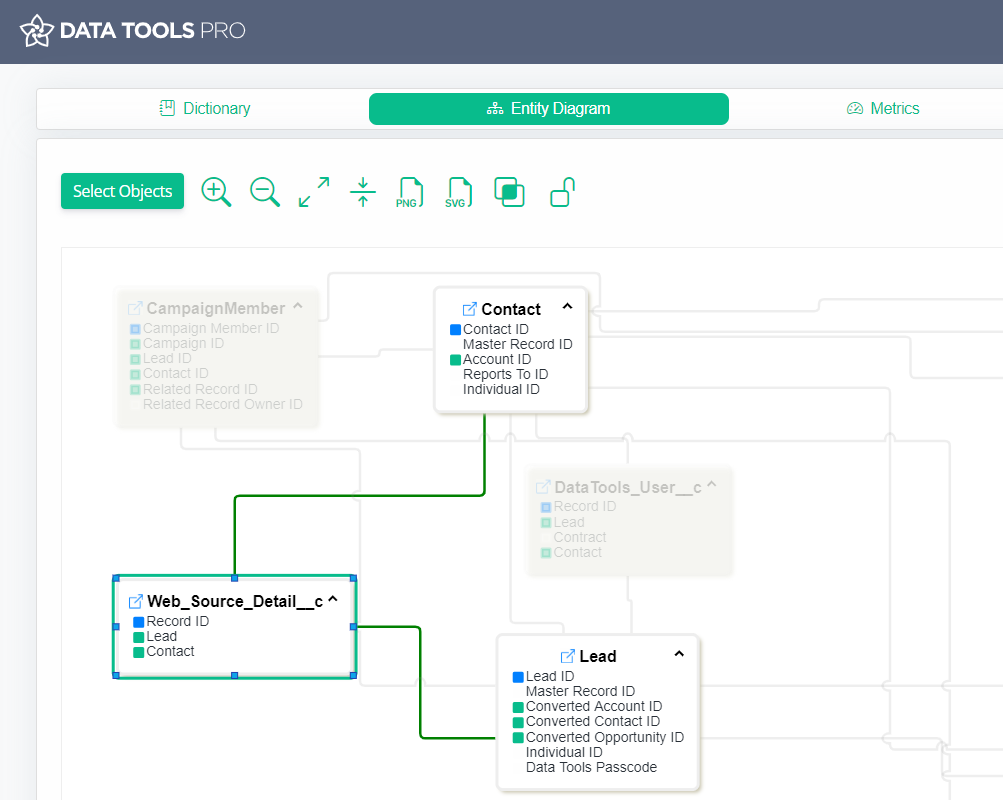
New Salesforce ERD DataTools Released
Posted on August 10, 2024 | BY Ryan Goodman
Our DataTools Pro team created a free Salesforce ERD tool that generates clean, and clear Entity Relationship Diagram visualizations.

What is Metrics Governance and why you need it
Posted on August 09, 2024 | BY Ryan Goodman
Metrics governance refers to the systematic approach to managing and maintaining the accuracy, consistency, and reliability of metrics.
The Role of a Salesforce Metrics Dictionary in Promoting Team Cohesion
Posted on May 21, 2024 | BY Ryan Goodman
To understand Salesforce metrics challenges, let’s evaluate a common situation. Your executive leadership asks Sales, Marketing and operations to present ...