Collaboration is key when multiple teams work with complex business applications like Salesforce. Seamless teamwork across technical roles ensures that everyone, from administrators to analysts, are on the same page. This leads to more efficient processes and better outcomes. Yet, achieving smooth collaboration can be challenging when different teams need access to shared data and meta data resources and clear communication channels.
DataTools Pro is designed to help cross organizational challenges head-on. By offering a range of tools tailored for Salesforce, DataTools Pro simplifies cross-team collaboration. Tools like the Metrics Glossary and Interactive ERD make it easy for teams to understand and communicate relationships business and data relationships, promoting transparency and alignment across various departments. This ensures that all team members can access up-to-date metrics and reports relevant to their roles.
The ability to streamline data management, governance, and improve communication can have a substantial impact on your business operations. With DataTools Pro, teams can work together more efficiently, reducing the time spent on data-related tasks and focusing more on strategic decision-making. In this article, we’ll explore how DataTools Pro enhances team collaboration in Salesforce, diving into its key features, best practices, and the overall benefits of its implementation.
How DataTools Pro Enhances Team Collaboration in Salesforce
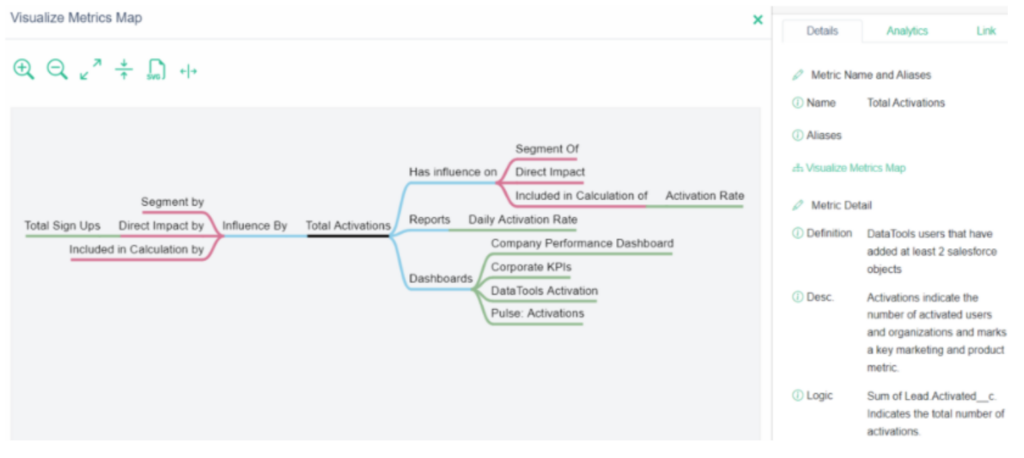
DataTools Pro significantly improves team collaboration within Salesforce by offering a suite of features designed to make data more accessible and understandable for everyone. One of the main ways it does this is through its Metrics Glossary. This tool ensures that all team members, from Salesforce administrators to data analysts, have access to a shared, up-to-date glossary of metrics. By tracking and updating Salesforce metrics, the Metrics Glossary helps everyone stay aligned on key performance indicators and how they are measured across systems like Salesforce and Tableau.
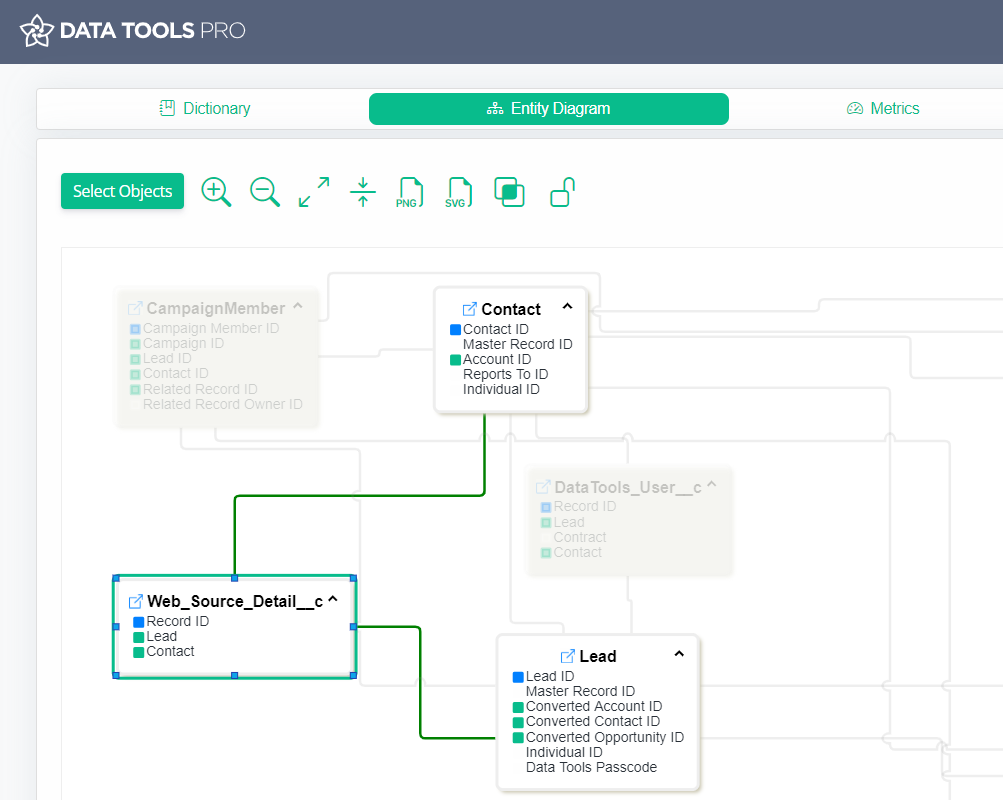
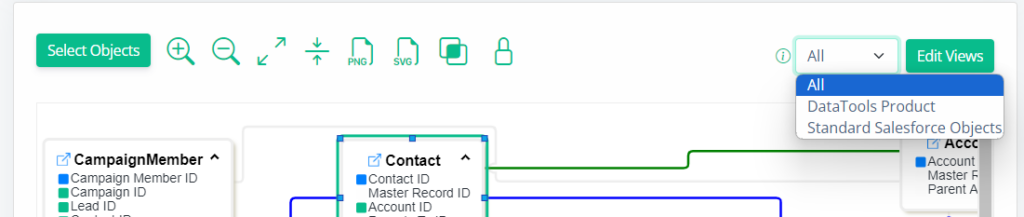
Another vital feature that enhances collaboration is the Interactive Salesforce ERD (Entity Relationship Diagram). Teams often struggle to understand the both basic conceptual relationships and nuanced complexity between different Salesforce objects. The Interactive ERD visualizes these connections in an easy-to-understand, color-coded format. This makes it simpler for teams to collaborate on data-related projects, as they can easily see how different objects interact and affect one another. DataTools transforms an ERD from a technical data administration tool to a business communication tool.
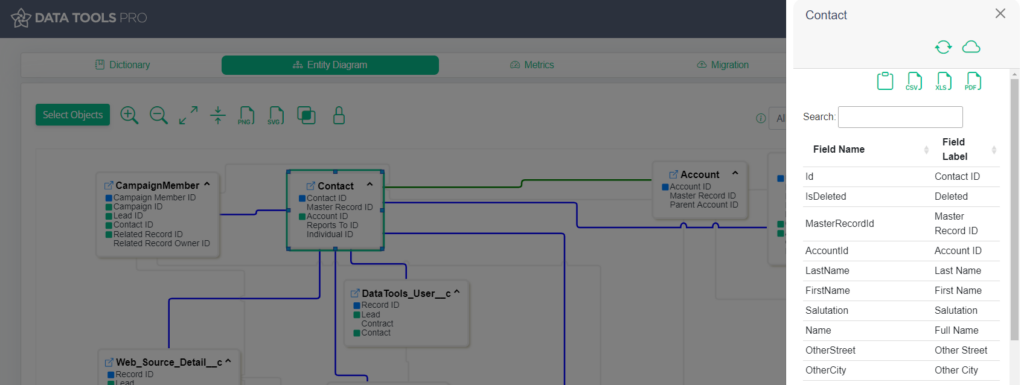
Moreover, DataTools Pro includes a powerful Data Dictionary for Salesforce. This tool provides quick access to Salesforce objects and fields, aligned with business initiatives. Having a centralized, live documentation asset allows team members to easily find and use the data they need. This minimizes the time spent searching for information and maximizes the time spent on productivity.
Key Features of DataTools Pro for Streamlined Collaboration
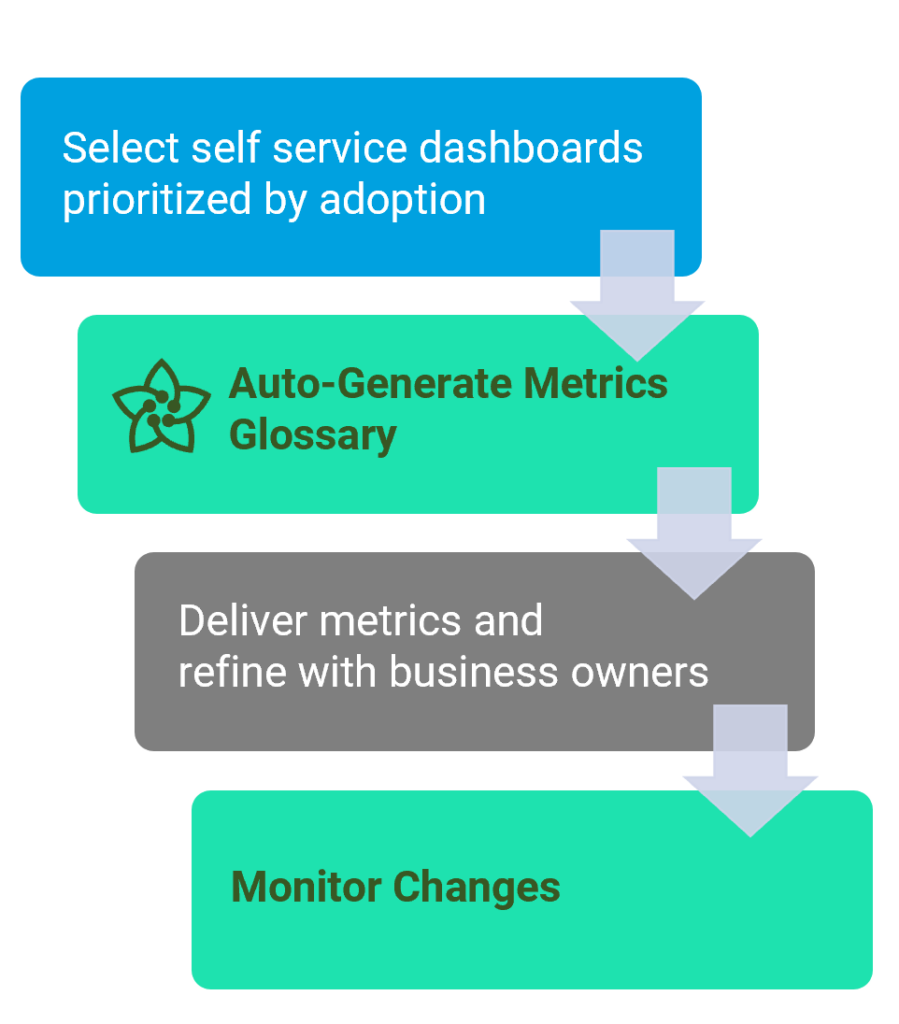
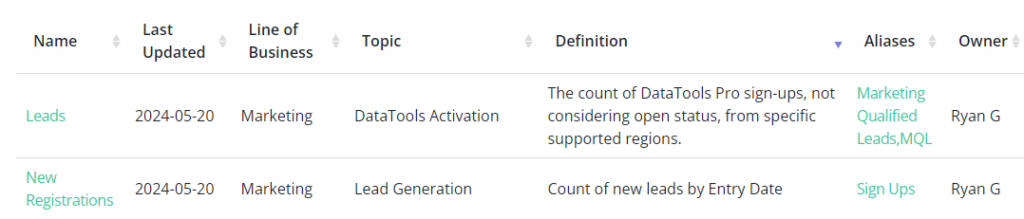
1. Metrics Glossary for Salesforce: The Metrics Glossary is essential for keeping track of and updating Salesforce metrics. It ensures that your documentation evolves with your business processes. This tool helps everyone in your organization understand the relationships between metrics, reports, and business topics. You can also easily publish and export your metrics glossary, which aids in maintaining consistent communication across teams.
2. Interactive Salesforce ERD: This feature allows you to auto-generate and organize your Salesforce Entity Relationship Diagrams. By selecting relevant objects from your dictionary, you can create intuitive, color-coded diagrams. These visuals help teams quickly understand the connections between different Salesforce objects, making data management much more straightforward.
3. Salesforce Data Dictionary: The Data Dictionary was created for analysts, admins, and data professionals. It provides quick access to Salesforce objects and fields that align with your business initiatives. Unlike static Excel sheets or outdated published dictionaries, this live documentation asset keeps track of changes in real-time. This helps teams understand the impact of changes on reporting and analytics.
4. Salesforce Data Migration: The Data Migration mapping tool simplifies the process management of mapping Salesforce objects and fields. It replaces spreadsheets, reducing errors and making the process more efficient. By generating usable SQL code, it helps teams iterate between field mapping and ETL (Extract, Transform, Load) for data migrations, regardless of size. This ensures that data transitions smoothly and accurately.
5. Salesforce Analytics Management: This feature is designed to help manage the lifecycle of hundreds or even thousands of Salesforce dashboards and reports. Through advanced categorization and search capabilities, teams can easily find the right information and keep track of dashboard adoption. This ensures that the most relevant and useful data is always at your fingertips, boosting overall efficiency.
Best Practices for Using DataTools Pro to Improve Collaboration
To get the most out of DataTools Pro and enhance team collaboration, it’s important to follow some best practices. Here are a few tips to help you maximize the benefits of this powerful tool:
1. Regularly Update the Metrics Glossary: Keep your metrics glossary current by regularly updating it. This ensures that all team members have access to the latest data and understand the metrics relevant to their work. Regular updates help avoid confusion and maintain consistent communication.
2. Utilize the Interactive ERD: Make full use of the Interactive Salesforce ERD by organizing your entity relationships by business topic, initiative, or application. This visualization helps teams quickly understand how different Salesforce objects are connected, making it easier to collaborate on projects and align strategies.
3. Maintain the Data Dictionary: Keep your Data Dictionary up-to-date to provide quick access to Salesforce objects and fields. This live documentation helps analysts, admins, and other data professionals find the information they need without wasting time. It also ensures that everyone is working with the most current data.
4. Streamline Data Migration: When planning a Salesforce data migration, use the Data Migration mapping tool to ensure accurate mapping of objects and fields. This helps prevent errors and makes the migration process smoother and faster. Generate usable SQL code to streamline the task of mapping data points and iterating between field mapping and ETL.
5. Organize Analytical Dashboards: Use Salesforce Analytics Management to categorize and search for reports and dashboards efficiently. Organize these assets in a way that makes them easy to locate and use. This will help teams keep track of dashboard adoption and ensure that the most relevant data is always accessible.
Benefits of Implementing DataTools Pro for Team Collaboration
Implementing DataTools Pro can bring a range of benefits that enhance team collaboration and overall productivity. Here are some key advantages:
1. Improved Efficiency: By providing tools like the Metrics Glossary and Data Dictionary, DataTools Pro reduces the time team members spend searching for information. This leads to more efficient workflows and allows teams to focus on important tasks.
2. Better Data Accuracy: Tools like the Salesforce Data Migration mapping tool ensure that data is accurately transferred between systems. This reduces the risk of errors and maintains the integrity of your data, which is crucial for making informed business decisions.
3. Enhanced Communication: The Interactive Salesforce ERD and Metrics Glossary promote clear communication among team members. These tools help everyone understand data relationships and metrics, leading to better collaboration and fewer misunderstandings.
4. Effective Data Management: Salesforce Analytics Management helps teams govern the lifecycle of their dashboards and reports. Advanced categorization and search features make it easy to find and utilize the right data, ensuring that teams always have access to the most relevant information.
5. Alignment with Business Goals: DataTools Pro helps teams align their data management practices with business initiatives. This alignment ensures that data efforts support overall business goals, driving better outcomes and adding value to the organization.
Conclusion
DataTools Pro was built for cross team access and documentation of Salesforce assets. By offering a range of powerful tools, it simplifies the way teams collaborate and manage data. From the Metrics Glossary to the Interactive ERD, each feature is designed to improve efficiency, accuracy, and communication. These tools help keep everyone on the same page and ensure that data is used effectively to support business goals.
Implementing best practices when using DataTools Pro can further enhance these benefits. Regular updates to the metrics glossary, organized entity relationships, and streamlined data migrations are just a few ways to get the most out of this tool. As a result, teams can work more efficiently, make better-informed decisions, and drive their business forward.
Ready to streamline your team collaboration in Salesforce? Discover how DataTools Pro can help you achieve greater efficiency and alignment with your business goals. Visit our website today to learn more!