
Solving the Multiple Versions of Truth Problem with Semantics

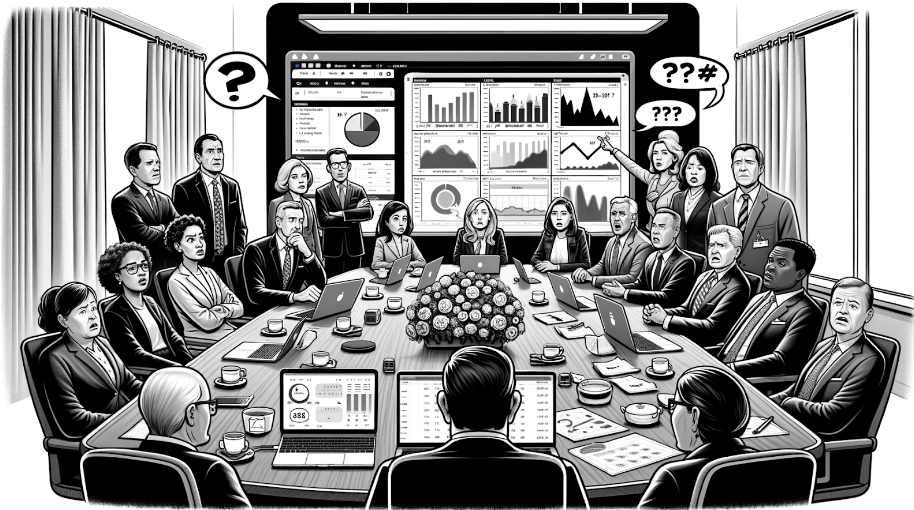
Every enterprise struggles with the ‘multiple versions of truth’ problem. The anecdote where two people show up to an executive meeting with 2 different numbers for the same metric is a real problem. These meetings can get tense where semantics are argued instead of recommendations and actions. As someone responsible for data and analytics, I’ve felt the pain of these moments, especially when the source of confusion and solutions to resolve are simple. These are points where trust the information delivery pipeline (applications, data, analytics, information) are put in to question.

Enterprises with mature data and analytics practices still have these problems. Simple issues like mismatched timestamps, unclear filters, or inconsistent metric names can cause time wasting misunderstandings. Sometimes the root cause is competing reports or poorly aligned definitions. Other times, it’s just a lack of shared understanding.

This article explores the role of semantics in enterprise reporting and offers practical solutions to eliminate conflicting truths, starting with the simplest fixes while highlighting some of the lessons AI integrators can learn for the shortcomings of Business Intelligence.

Some multiple versions of truth problems are caused by semantics disconnect

Solving enterprise semantics problems with a data-first mindset is incredibly difficult. It’s like trying to solve a Rubik’s cube where the colors change constantly. There are plenty of smart folks out there taking a fresh look at this problem. I refer to this bottom up (data first) perspective where the objective function is connect data to meaning. This meaning helps describe how to manipulate data into a business consumable format that is to connect and theoretically reusable across analytical problems. I remain skeptical that building new data semantics layers without without process and functions for governance is creating the same problem in a new place; hoping for a different result.

multiple versions of truth

Technology-centered perspective: For a long time, data and analytics platforms vendors have taken a self-centered view of the semantic layer. As a result, semantics are scattered and disjoined across self service reporting business applications, and now data platforms. There common variables across semantic layers are very thin and provide enough meaning for analysts and analytics professionals to create. The actual semantics and understanding of the semantic layer sadly is tribal knowledge or fragmented documentation. Universal semantic layers like At-Scale that could have the right solution at the right time.

My history and perspective:

Years ago, my time working at BusinessObjects taught me a lot about what works and doesn’t work with universal semantic layers. I have never had so much fun working in enterprise data and analytics during those days. I watched intense focus and high emphasis on governance and process to create a single source of truth. What happened? Service tools like Tableau, Qlik, and Power BI took off and what we consider today modern data platforms (cloud data warehouse) matured. These tools been transformational for me as a practitioner to get done in days what took months as I create re-usable models and blueprints.

Why Semantics Matter

Business semantics is the general corporate language or business vernacular used day to day. Ignoring all of the structures and technical jargon…. Terms like ‘customer,’ ‘revenue,’ and ‘activated’ are three common examples where meaning in a single organization can vary based purely on who, where, and what you are discussing. Semantics can be organized into a variety of structures for capturing meta data like semantic layers, taxonomies, glossaries and or embedded into more advanced frameworks like graphs and ontologies. You can walk into two different companies that compete in the same industry segment and experience different semantics.

Data/ analytics semantics aka “semantic layers” include the technical definitions, relationships, and rules that translate raw data into metrics, dimensions, and facts. This structured layer often defines how data is joined, filtered, aggregated, and labeled. This makes it possible for consistent reporting across BI tools and business functions. As the business intelligence function became decentralized and organizations purchased multiple tools, some enterprises struggle with multiple versions of truth purely as a function of disconnect between business semantics and semantic layers. A semantic layer that is not maintained and governed can produce incorrect results.

6 Simple Causes (That Have Nothing to Do with Your Semantic Layer)

The presence of semantic layers, even when executed flawlessly, will not always solve the multiple versions of truth problem. If you have 1 system of record, 1 semantic layer, 1 report… You can still end up with multiple versions of truth! Here are the common real-world instances that occur regularly with ultra simple solutions!

#1 Differing date/time dimensions: Example: Cohorts vs Activities.

Someone pulls a cohort-based metric into a report. A second person pulls the same metric from a historical trend for that metric. Both report the same period of time but the numbers are different! Both parties are correct, but reporting semantically different versions of what happened.

Solution: Improve the title and apply a detailed description and disclaimer in reports.

In data geek speak… A single metric can exist in one semantic layer, but when reported, it can be sliced by different time dimensions, which alters its semantic meaning. The problem and solution is proper explanation of semantic meaning when this information is delivered. You could have two metrics expressed in your semantic layer.

#2 Same numbers pulled at different point in time.

Same report pulled at different point in time. In this case both parties are correct.

Solution: Add an “as of” date clearly to every report or dashboard. I’m still surprised how often this simple step is skipped. I am guilty of it myself…

#3 Two flavors of same metric (from same self service report)

Someone views a metric through a different filter or lens, leading to two versions of the same number — without any context explaining how the data was filtered.

Solution: This is a scenario where data semantics maters and business semantics need to converge. In my approach with our metrics glossary we include context data that surrounds the use of a metric.

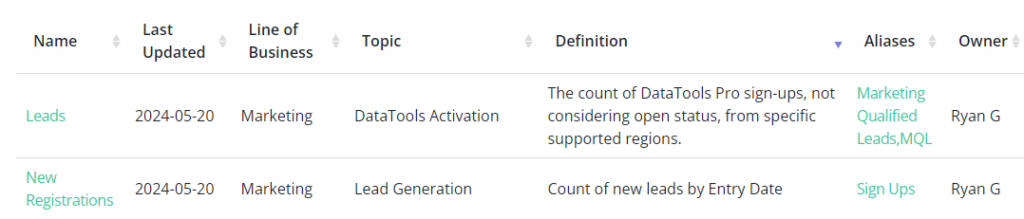
#4 Aliases and naming conventions

PowerPoint slide includes a key metric, but the name used on the slide doesn’t match the name used in the report. This disconnect can create unnecessary confusion or debate.

Solution: Sometimes it’s a case where the same metric has multiple names.. Other times, it’s just an error that wasn’t caught.

#5 Change management

Changes in the application, data, or analytics pipeline can introduce inconsistencies. When these changes are systemic or ongoing, you need to dig deeper to identify the root cause:

  • Limited team capacity or lack of training
  • Missing or ineffective governance processes
  • Gaps in software development lifecycle (SDLC) practices
  • Accumulated technical debt or platform bloat

Solution: Every customer has its own issues delivering consistent and reliable decision support. The root cases here in my experience is all over the board.

#6 Excel exports and manipulation

Data gets exported to Excel, where it’s often modified, transformed, or manually blended. It’s then presented alongside official reports, leading to inconsistencies that are difficult to trace.

Solution: Alignment and evaluating Excel logic is typically required to get to a solution.

These issues are a small sample of use cases I have captured to create process and tools to help address them. So what if the root of your problems and prescribed solution is creating a new semantic layer…?

Solve Multiple Versions of Truth with Semantics Layer Alignment

1: PEOPLE: Creating a semantic layer is the starting line and not the finish line

Teams need to find a way to close the gap between information consumers and the semantic layer creators. Rarely does a business consumer’s understanding of metrics start from the creation of a semantic layer. Newly created semantics and metrics that shed new light on the business process require even more alignment and care.

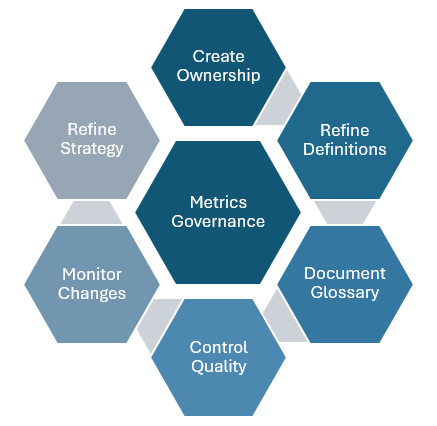
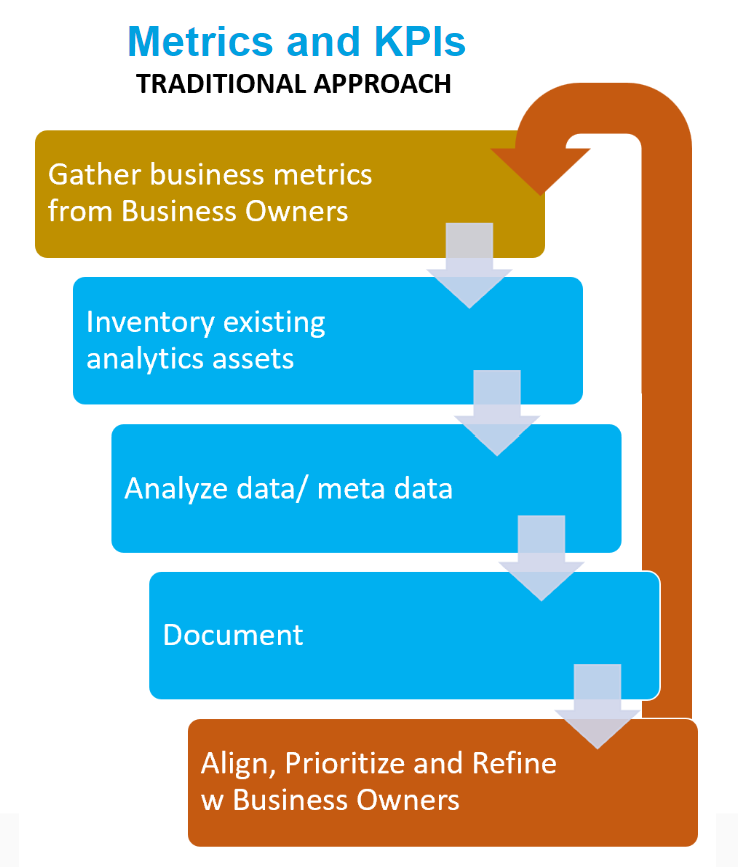
2. PROCESS: Semantic layer management done right is a governance process and NOT a technology requirement gathering process

Create a recurring governance process to align on the organization’s most important semantics, specifically metrics, KPIs, facts, and dimensions. Effective governance is not about tools or data for that matter.. It’s about structured conversations, shared understanding, and formalized communication pathways, and accountability.

3. TECH: Capturing when, how, why and where changes happen that distorts facts?

Use metadata tools, or catalogue tools with audit capabilities. Audit usage, monitor schema drift, and understand where facts get distorted. Technology alone won’t solve your problems, but it can shine a light on root causes.

4. AI: The hype is justified, but the reality is messy

Semantics of all types will remain a hot topic tech and service companies compete to become your go-to AI/ BI solution. The idea of having an in-house AI analyst, available 24×7 to answer business questions with data, is compelling. And to be fair, there’s a lot of real innovation happening in this space

I approach this constantly wanting to work my way out of a job. But based on my own testing, I’d describe today’s AI analysts as something that is technically capable, but operating as if it’s their seventh day on the job; and they’ve got a touch of amnesia.

That’s not a critique from the sidelines. I’ve loaded these models with structured data semantics, business context, report and dashboard metadata, usage logs, and conversational history. The confident insights and stats are magical. If feels less magical when you already know the correct answers.

So what happens when a business stakeholder walks into a meeting, proudly armed with insights from their new AI assistant, only to discover the output is way off? AI gets thrown under the bus.

Semantic layer gone wrong

How do you set yourself on the right path to create a useful and correct semantic layer with current technology solutions?

If you are a data or analytics professional getting started and wanting to implement a semantic layer and want to maximize adoption, I recommend the following advice:

  1. Get out of the database and sit in on meetings where metrics are presented and debated.
  2. Conduct a metrics governance alignment meetings between business stakeholders.
  3. Put emphasis on standardizing and organizing curated reports for executive facing meetings.
  4. Create internal naming conventions, tooltips, and glossary tags for reuse.

Have more advice or experiences that you want to share? Let me know!

More info on how I am solving semantics problems at DataTools Pro

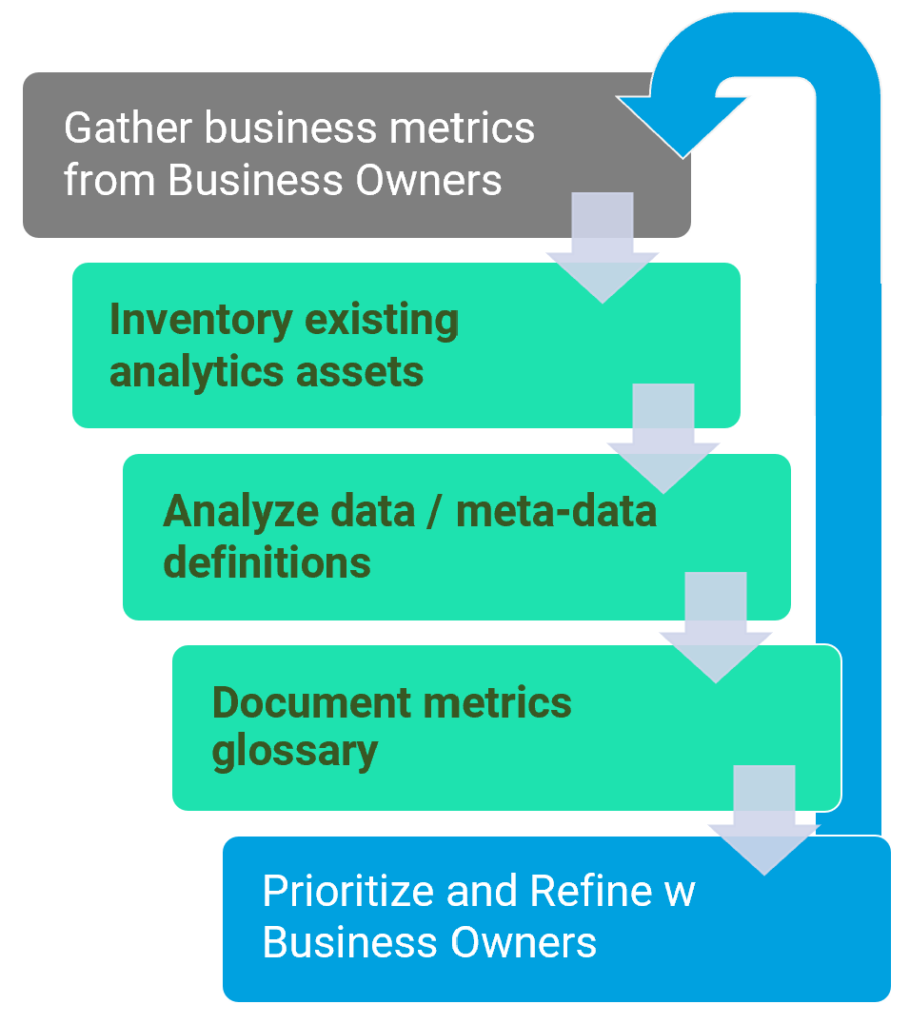
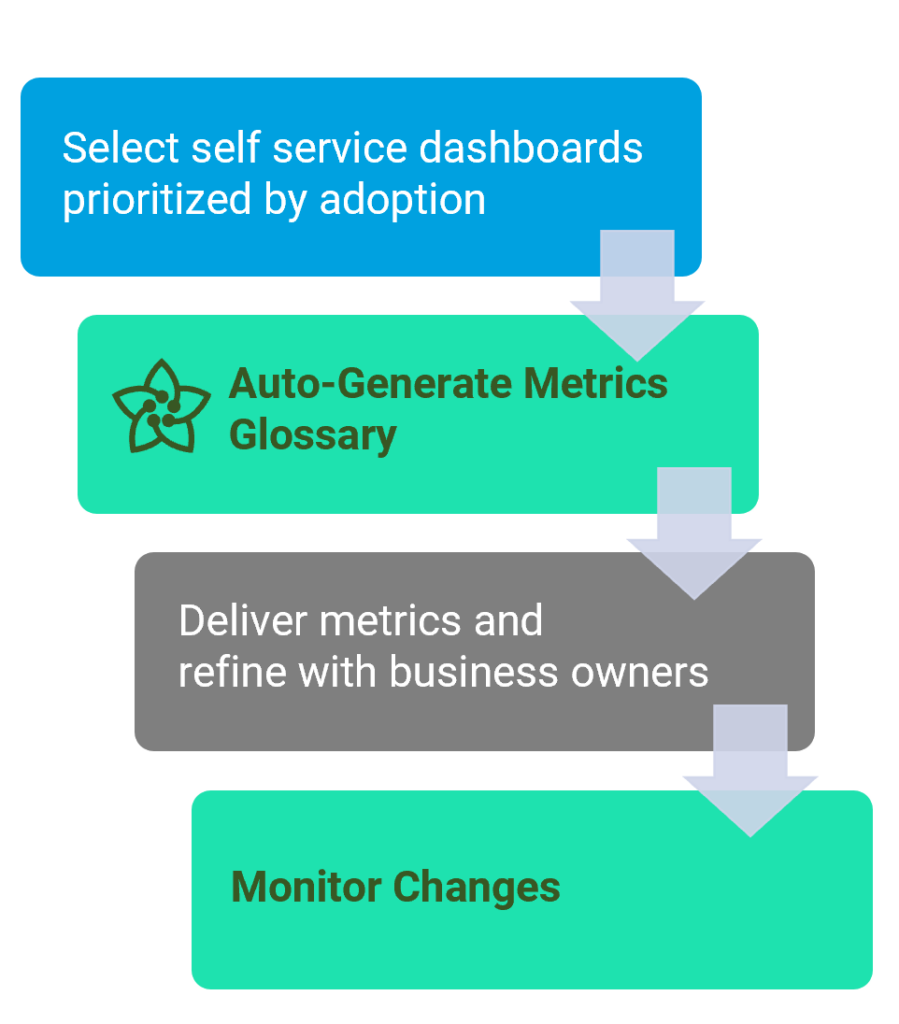
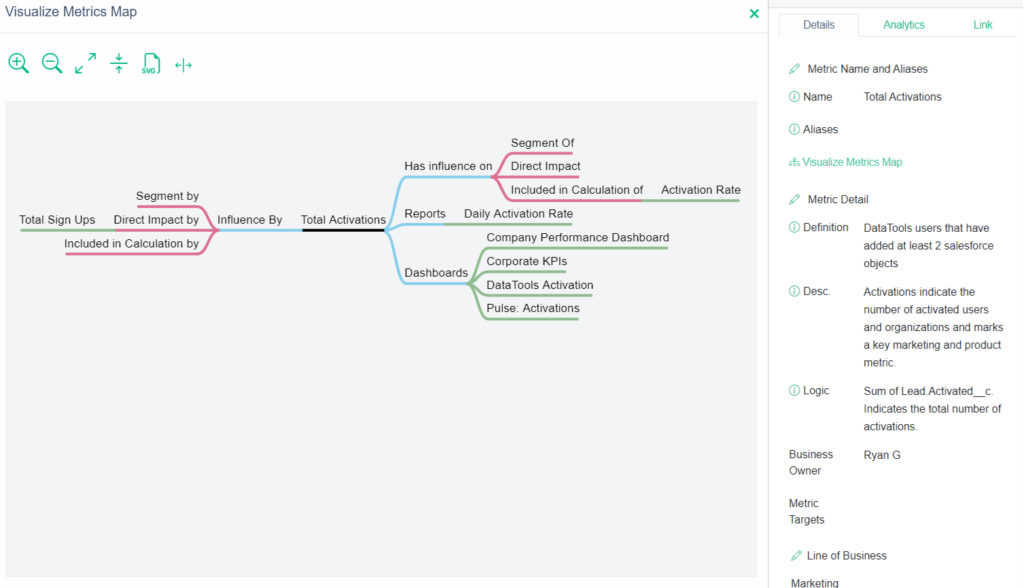
In 2023, I set out to automate discovery, alignment, and change tracking for metrics and KPIs. The goal was simple: speed up onboarding and improve trust in metrics definitions. What we built, and continue to refine, is a metrics-first approach to semantic alignment. We released metrics analyst in early 2024 and have continued to refine in our vision. Shaped by customer feedback, failure, and iteration, we are releasing version 2 this summer!

I’m excited to solve at least one side of the Rubik’s Cube… even if the colors keep changing. Feel free to schedule a call to learn more!

What is Metrics Governance and why you need it

Metrics Governance

Ensuring accuracy, consistency, and reliability in business metrics

Metrics governance refers to the systematic approach to managing and maintaining the accuracy, consistency, and reliability of metrics used within an organization. It is crucial for achieving data-influenced decisions by ensuring that the metrics used in reports and dashboards accurately. Without metrics governance, organizations often encounter inconsistent reports, leading to confusion and mistrust in the data. This article explores how the “single source of truth” problem is best addressed by governance process.

Metrics Governance Throne

Why Metrics Governance is difficult?

Metrics governance is difficult mostly because it is a cross organizational problem relying expertise, understanding, and distribution of knowledge regularly across teams. Getting data governance right is tough enough! Modeling data and applying business rules to understand results and outcomes adds another layer of complexity. Typically this complexity is inherited by professionals responsible for creating business intelligence and operational reports. Your metrics and KPIs that drive your organization are extremely important. The reality for many growing enterprises is metrics definitions live scattered across teams, documents, and technology applications. Every business has to make the right decision where to implement a glossary of metrics but there is no shortage of great technology solutions to put those definitions into motion:

  • BI and Analytics tools like Tableau Pulse let analysts build a library of metrics
  • Data development platforms like DBT provide a semantic layer to code and manage definitions, including metrics
  • Google Analytics has built-in metrics and standardized definitions into the core application

These 3 examples are typically managed by different teams highlighting where gaps can occur thus providing the inspiration for the graphic for this post. We believe in a federated approach to analytics is effective but a centralized repository of metrics definitions is needed not only to improve analytics, but to improve employee onboarding and AI co-pilot training.

Metrics Governance vs. Data Governance

While metrics governance and data governance are closely related, they have distinct focuses:

  • Data Governance: This involves the overall management of data availability, usability, integrity, and security within an organization. It encompasses data quality, ownership, stewardship, and compliance with data privacy regulations.
  • Metrics Governance: Specifically focuses on the metrics that are definitions intended to measure business outcomes using data. It deals with the definition, standardization, monitoring, and validation of metrics to ensure they are accurate and consistent.

Metrics governance complements data governance by ensuring that the metrics used to make business decisions are based on high-quality data and are consistently applied across the organization. The key difference lies in the scope—data governance is broader, covering all aspects of data management, while metrics governance zeroes in on the metrics themselves.

Steps to Implement Effective Metrics Governance

To implement effective metrics governance, organizations you should consider these typical areas of improvement:

Metrics Governance Flow
  1. Promote a Culture of Accountability and Data-Driven Decision-Making: All metrics should have business owners. Accountability and ownership of metrics and how to use them helps every team involved. This fosters a culture of accountability and ensures that decisions are based on reliable data.
  2. Establish Clear Definitions and Standards: Define metrics clearly and ensure that these definitions are understood across the organization. This prevents confusion and ensures consistency in reporting.
  3. Create a Centralized Metrics Glossary: Maintain a centralized repository of metrics to ensure consistency and easy access. This helps in tracking and managing metrics effectively. Here is a free template on: Notion Metrics Glossary Template
  4. Implement Data Quality Management Practices to your metrics: Ensure that the data used to calculate metrics is of high quality. This includes data validation, cleansing, and regular audits.
  5. Regularly Monitor and Validate Metrics: Continuously monitor metrics to ensure they remain accurate and relevant. Regular validation helps in identifying and addressing any discrepancies.
  6. Metrics Governance management as part of your data strategy – Understand where and how metrics are managed and deployed. Learn more about analytics strategy playbook

We would love to hear how you manage and standardize your metrics and KPIs. Our team at DataTools Pro is working on solutions to help automate the traditional metrics fact gathering and metrics glossary preparation steps!

The Role of a Salesforce Metrics Dictionary in Promoting Team Cohesion

Salesforce Metrics meeting

To understand Salesforce metrics challenges, let’s evaluate a common situation. Your executive leadership asks Sales, Marketing and operations to present last quarter’s results. Everyone shows up with slides and reports pulled from Salesforce or a Business Intelligence platform like Tableau. Frustration grows, as presented numbers and statistics may not align or contradict each other. Instead of discussing strategy and tactical adjustments to improve performance, time is wasted asking for clarification on the validity of information. If this sounds like your experience you are not alone. Prioritized, correct, and consistent information does not happen overnight. In this article we will explore our approach to help create a better foundation, working with the people, process, and technology you already own.

Salesforce Metrics Meeting

Most enterprises have multiple sources and approaches to acquire data and transform it into information. We love Salesforce because of the relative speed and ease to build and make changes to process, with clear and easy reporting. There are over 150K organizations like yours that have standardized marketing, sales and/or revenue operations on the Salesforce platform. So why would a team with a system of record and  “source of truth” from Salesforce still struggle reporting and understanding and maintain continuity of information as change happens?

Avoiding people, process, and communication blame game

If you have been a part of reporting and analytics initiative that goes sideways, it’s sometimes based on these factors:

  • Flawed requirement gathering
  • Change management or lack thereof during implementation
  • Incomplete or incorrect definitions
  • Lack of consensus across lines of business for goals and metrics
  • Data completeness, availability, and quality

Building an inventory of metrics and KPIs can be an exhaustive process leading to gaps in requirements as a result of not having the right people or experience on hand. In other cases, data quality and availability becomes a friction point that leads to failure. Modern data and analytics technology will help you move faster, dig deeper, model and blend data but not solve un-resolved definition and alignment problems.

In many organizations, there isn’t a solution in place to maintain a unified record and historical log of goals, metrics and data relationships together. Documents, PowerPoints and Excel are typically the system of record for metrics and KPIs until they are coded into data and analytics tools.

If your previous data lake, analytics, and business intelligence initiatives fell short, the blame is all to often put on process, people, and communication often encapsulated sometimes as “poor requirement gathering”. Experienced and tenured data and analytics leaders understand this excuse wont fly in 2024, so our team learned into these challenges to see how we can help!

Our DataTools metrics glossary approach

1. How do we capture and encapsulate the previous work that has happened inside of Salesforce to understand existing metrics and KPIs are adopted and in-use?

2. From this understanding, what is the knowledge that we need to capture and resulting information assets that we need to produce and distribute? One of those key information assets is Salesforce Metrics Documentation

.3. Eliminate most if not all of the manual and redundant work that typically occurs between teams that can be easily extracted from Salesforce metadata?

4. Knowing that this is a live, organic, information asset how do we understand and surface changes that stakeholders should be aware of?

From those questions, we constructed our vision of a metrics glossary that not only captures the metrics but all of the relationships that stem from those metrics.

Lean more about DataTools Pro

Automated Salesforce Metrics Glossary


We took these questions and built a Metric Analyst tool that attempts to automate most of the process.

Live Salesforce Metrics Documentation

One of the important pieces of information that anyone in your enterprise wants to know is “what’s important”? A metric and KPI glossary can exist as a word document, spreadsheet, email, or application that organizes the business definitions. Salesforce metrics documentation should inventory the definitions semantics for metrics where data originates in Salesforce. This document should serve as a knowledge asset and guide to to help cross organization collaboration for business, data, analytics, and technology teams. When properly implemented it should ensure everyone speaks the same, specific language in business terms. A metrics glossary can also include technical / data details to help understand some lineage details.

What are Salesforce metrics?

Salesforce metrics are quantifiable measurements that track business processes, and activities that occur in Salesforce. Salesforce is much more than a customer relationship management platform. Some companies run their entire end to end operations on Salesforce. A metric can encompass anything from sales pipeline health to customer support resolution times. However, with a vast amount of data and numerous metrics available, ensuring consistent understanding and interpretation becomes crucial. Learn more: Analytics, Metrics and AI. Oh My!

Why do you need a Salesforce metrics dictionary?

Let’s revisit the scenario at the beginning of this article. If we take a simple measurement for “Lead conversion”, you can imagine the many variations and iterations of this metric. For example marketing could consider a marketing qualified lead, where sales considers “sales qualified” leads. Conversationally they can be interchanged, but at an organizational level, this misunderstanding could be simple semantics and labeling. A Salesforce metric dictionary acts as source of truth ensuring everyone speaks the same language when clarity and precision is mandatory.

  • Standardization: Defines clear and consistent definitions and calculations for all metrics.
  • Improved Communication: Eliminates confusion and fosters better collaboration across teams.
  • Enhanced Data Accuracy: Reduces errors by ensuring everyone uses the same metrics and formulas.
  • Streamlined Analysis: Makes data analysis faster and more efficient by providing a central reference point.

What Does a Salesforce Metric Dictionary Include?

An effective Salesforce metric dictionary should encompass the following key components:

Mandatory definitions that are managed and governed across lines of business

Metric Name: The name of the metric, clear and concise. There should be 1, official name that ties to a definition. If there are multiple names for the same metric, that is captured and tracked independent of the official name.

Definition: In simple terms what is the metric measuring. This definition may require some detail to how it is calculated but should be readable and understandable to business information consumers and owners.

Ownership: Who is the person ultimately responsible for the metric? The premise is that if there is no clear ownership and accountable person to sign off or accountable for the metric then it shouldn’t be managed.

Important context and ownership information to support usage of definitions

Description (optional): A detailed explanation of what the metric measures and its significance to your business goals. In a world with AI agents, my recommendation is the longer the description and the more context, the better!

Calculation (optional): The specific formula or steps used to calculate the metric. This ensures everyone understands how the value is derived. This work can be time consuming and requires salesforce admins to acquire these definitions.

Target Value/Benchmark: (optional): A target or benchmark to measure your metric against is common practice. Not all metrics will have a target, but a KPI absolutely should!

More reading on metrics, OKRS and KPIs: Analytics, Metrics and AI. Oh My!

Salesforce Metrics Dictionary Template

While Salesforce doesn’t provide a built-in metric dictionary, you can create using a spreadsheet tool like Microsoft Excel or Google Sheets, and now a live connected Metric Dictionary like DataTools Pro. The following table showcases a sample structure:

Additional Tips for Managing Salesforce Metrics

  • Maintain and Update: Schedule regular reviews to assess the dictionary’s accuracy and completeness. As Salesforce evolves and your business needs shift, update metric definitions, calculations, and target values to reflect these changes. This is an important component for information stewardship, governance, and safeguarding the integrity of your organization’s management information systems.
  • Access and Distribution: Don’t let your metric dictionary become a hidden and outdated document. Share it widely with all Salesforce users – sales reps, marketing teams, customer service agents, and anyone who interacts with your CRM data. This is a big part of fostering a culture of data literacy and ensures everyone interprets metrics consistently.

Conclusion

By implementing a Salesforce metric dictionary, you empower your organization to leverage the true potential across teams and lines of business using a language that should be universal (business performance and outcomes). Standardized metrics ensure clear communication, accurate analysis, and ultimately, data-driven decision-making that fuels business success. Here are some resources to help you take control of your Salesforce metrics today and unlock the key to a more informed and strategic CRM strategy.

Creating a Metrics Mind Map with DataTools Pro

Metrics Mind Map

One of the best tools for visualizing and conceptualizing relationships between any topic is a mind map. We with a mind map when we started DataTools Pro in late 2023. The mind map is easy to conceptualize visually as we connect the dots between people, process, metrics, and data. This is something that all enterprises struggle with while transitioning from service and product based businesses to information based businesses. Businesses are not static, so managing complex relationships that change regularly requires building and understanding these relationships at the speed business happens!

As we started turning our mind map concept into reality, we knew relationships between metrics, topics, data and analytics assets like reports and understanding changes that occur is hard enough.

That is where data visualization delivers immense value to bring data to life. The same way data professionals understand “Entity Relationships”, business professionals should have “Metrics Relationships” to understand how business initiatives, operations, and strategy connect.

That is why we created our Metrics Map visualization, powered by DataTools Pro to systemize this process. The first iteration makes each metric the center of the universe (in our visualization visualization). From a single metric we want to know what influences a metric or KPI and what the metric has influence over. With this starting point to discover, understand and relate metrics, we can work backwards to data and forwards to outcomes!

Metrics Map

Many analytics industry tech companies have focused on solving problems for accelerating data acquisition, transformation, and delivery. Generative AI, without contextual metrics glossaries jam packed with meta data will produce negligible results. It is the equivalent of hiring a data analyst and not explaining goals, metrics and analytics relates to the decisions out outcomes they influence.

We are excited to work with a number of like-minded partners in the realm of AI and data management to demonstrate profound improvements we are seeing when feeding our soon to be released metric maps API into generative AI analyst agents!

Create your first Metrics Mind Map from Salesforce and Tableau Pulse!

DataTools Pro is freely available for individuals and supports Salesforce and Tableau Pulse to build metrics glossaries and metrics maps.

Sign up for free

Learn more about DataTools Pro

Analytics, Metrics and AI. Oh My!

Recent AI advancements with large language models have broken through and forever changed how we think about information access and retrieval. Metrics and AI is at the top of my mind as AI agents today provide universal translation and curation of information. Here, in our data tools niche where we wrangle and transforming data into information, we are seeing incredible results using AI to write code and deliver the same results that traditionally required an analyst. We don’t believe AI will replace analysts, but we know already that AI augmented retrieval for researching large bodies of information a job better suited for machines. Enterprises need to re-frame documentation as context data generation for people and AI. You will likely see a rise in “knowledge graphs” as a hot topic. Unstructured data has always been deemed “untapped” gold, so now the race down the yellow brick road is on!

Behind the Curtain: Unveiling the Reality of Modern Bots

Chatbots have propelled large language models into the forefront. The benefit of these AI chatbots to individuals is the way an LLM can breaking down knowledge and experience into personalized bite sized information chunks. We are not too far from this being a shared experience in a collaborative setting. This is where we can see early adopters super charge team productivity. The big opportunity is how how enterprises will use AI to curate and deliver information us using the vast collections of empirical knowledge created over time. It goes without saying there are lots of smart people working tirelessly on these problems. Here at DataTools Pro, we are obsessed with this problem as a small scrappy team.

Does self-service analytics help?

Analysts, data scientists, and data professionals have always been required to distill complex business concepts into quantifiable analytics. Business Intelligence (management information systems) and Analytics disciplines still have the same problems today as 15 years ago. AI, LLMs and data platforms will not solve these problems without radical changes how people work.

  1. Age old “multiple versions of truth” problems still exist. It has moved from spreadsheets to self service reports and dashboards
  2. Empirical knowledge gained from pulling data together becomes disparate in spreadsheets, documents and PowerPoints, and email.
  3. Methods to build a live, connected semantic layers to categorize and measure quantitative performance remain siloed and technology oriented.

Reports, dashboards, and data remain the primary delivery mechanism for performance metrics and KPIs. The need for speed to prepare and deliver self-service analytics has shortcut slow moving BI platforms of yesterday. Similarly, modern cloud data platforms have helped democratized working with structured and unstructured data that historically required database administrators, software engineers, expensive technology components. “Deluge” is the best word to describe the state of most enterprises in regard to the number of data and analytics assets flowing thus creating newer “data mesh” and “data fabric” methodologies to help strategize designing systems and process to tackle the deluge problem. We are experimenting with this ourselves with Azure Co-Pilot while our team, data, and metrics library is small.

What about Self Service via Natural Language Requests?

Natural language queries is a feature and not a solution. Many professionals simply do not know what data and metrics are available to start asking questions. This is where AI agents armed with a glossary, semantics and a large body of context data will be transformational. AI co-pilots are still very new, so we are experimenting ourselves what is real vs art of the possible. The keystone is aligning AI and business professionals with a common taxonomy and language and where we are working to build a common thread between business, data, analytics, and soon auto-pilots aiding these teams.

What about data?

Many enterprises do not have enough resources behind data governance and management. I still think this is a massive area of opportunity to somehow democratize and distribute data management in a way that is non-intrusive. Otherwise our point of arrival for AI automation will be autopilots and agents spitting out useless information. Incorrect information leads to mistrust and failed adoption of “co-pilots”.

Data storage is dirt cheap and modern data platforms make it fast and easy to analyze and model data into sophisticated analytics. How do you create universal focus?

All roads to AI metrics and analytics mastery leads back to goals and data governance

Every company has a set of metrics that indicate the health of the business. Your financial metrics within your income statement and balance sheet don’t get a lot of love on social media, but they are the bedrock to your performance (assuming you are a for profit business). Highly sophisticated metrics or amassing hundreds of metrics wont translate to good performance. Universal understanding, consistency, correctness and execution against a finite set of metrics will!

Quick metrics maturity quiz:

  1. Do you have an inventory of all of the metrics your operational team is using?
  2. Who are the owners, stakeholders, and oracles (keepers of institutional knowledge)?
  3. Are you certain those metrics are calculated and deployed consistently across teams and individuals?
  4. Are your business, technology, data and analytics teams aligned how to implement these metrics into analytics?

Fact Finding Process:

Traditionally, this is the process most consultants utilize to thoughtfully acquire and organize your metrics glossary. Many enterprises already have documents, presentations, or spreadsheets with this information formally gathered. Rarely are they universally understood and up to date.

Metrics requirement gathering

Getting consensus and universal understanding is slow and cumbersome. It is one of the challenges we wanted to tackle at DataTools Pro

From Metrics to Key Performance Indicators and OKRs

There are a number of different organizing principles and methodologies to translate your organizational goals into metrics. A KPI differs from a metric in that it has a specific target, timeline, and direct impact on your organizational goals and objectives. You may have dozens of metrics without targets, and that is okay. There are a number of widely adopted models to help you formally structure and organize your KPIs:

SMART Goals

SMART created by George Doran that offers a system for organizing and defining and measuring your business goals.

  • Specific – target a specific area for improvement.
  • Measurable – quantify or at least suggest an indicator of progress.
  • Assignable – specify who will do it.
  • Realistic – state which results can realistically be achieved, given available resources.
  • Time-related – specify when the result(s) can be achieved.

OKR – Object Key Results

  • OKR – An objective is a clearly defined, inspirational goal aimed at driving motivation and direction. Key results are specific, measurable outcomes used to track the achievement of the objective.

As you get deeper into the performance management, process improvement, you will discover what works best for your corporate culture.

How are metrics and KPI is evolving with AI

No article is complete in 2024 without a hot take on AI. A lot of the focus in technology and analytics is centered on amassing feeding large volumes of quantitative data into machine learning models to predict outcomes. Now with generative AI, we are vectorizing large bodies of data to train, fine tune or simply retrieve data using natural language requests. Unfortunately, without the right semantics, definitions, governance, and context data, your AI investment won’t feel magical. Our team is racing ahead knowing the path to have meaningful dialogue and results with AI co-pilots requires context. We have taken a novel approach to run along side enterprises on their journey down the yellow brick road to help with our upcoming DataTools Pro metrics analyst!

Join us for a webinar March 13 where we will formally introduce our Metrics Analyst AI.