Practical real world Microsoft Copilot vs Claude vs ChatGPT bakeoff in Excel and PowerPoint.
Salesforce and Snowflake data cloud blog

The Tableau vs Power BI Rap Battle: So Cringy it’s Addictive
Posted on December 18, 2025 | BY Ryan Goodman
A mash up the classic data-geek debate of "Tableau vs Power BI" into an AI-powered rap battle.
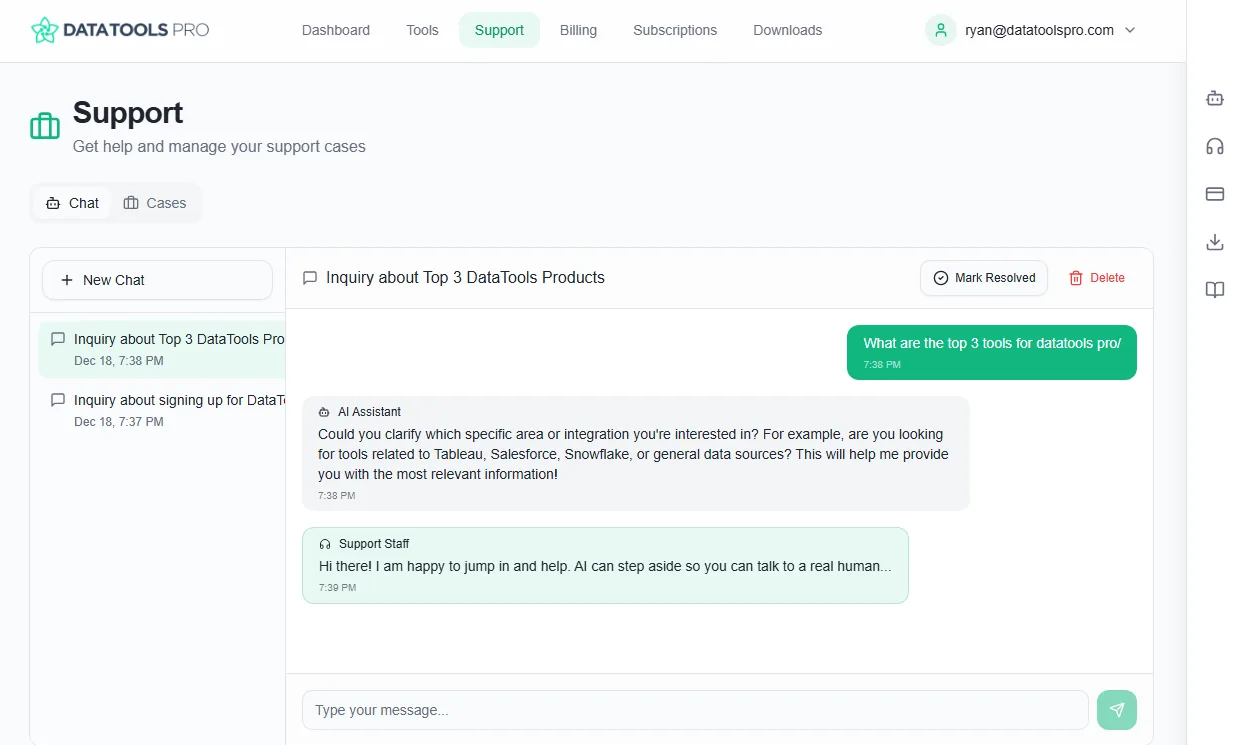
Testing Salesforce External Client App with our DataTools Portal
Posted on December 11, 2025 | BY Ryan Goodman
There have been so many changes to Salesforce connected apps in terms of integration and commercial requirements. Learn more
Our Thanksgiving 2025 Anthem: The Data Song
Posted on December 01, 2025 | BY Ryan Goodman
The Data Song will tell you something, and absolutely nothing about data at the same time!

Worksheet User Alternatives to Snowflake Workspaces
Posted on November 09, 2025 | BY goodmangro2dev
Alternative Snowflake Workspaces options for delivery to data workers and consumer roles.
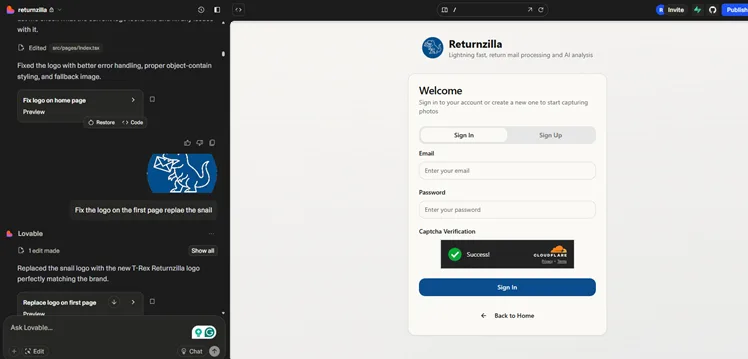
Lovable Vibe Coding: From Prototype to Production in 8 Hours
Posted on August 06, 2025 | BY Ryan Goodman
Lovable Vibe Coding is taking the world by storm. Learn how I went from prototype to production in 8 hours.
Adventures with Snowflake MCP and Semantic Views
Posted on July 30, 2025 | BY Ryan Goodman
Push real-world analytics use cases with Snowflake MCP and Snowflake Semantic Views.

Why AI-Generated Meta-Data in Snowflake Semantic Views Can Be Dangerous
Posted on July 16, 2025 | BY Ryan Goodman
AI-Generated meta-data in Snowflake Semantic Views can be dangerous. Learn how to stay safe and accelerate forward.

Solving the Multiple Versions of Truth Problem with Semantics
Posted on July 05, 2025 | BY Ryan Goodman
Every enterprise struggles with the ‘multiple versions of truth’ problem. The anecdote where two people show up to an executive ...
